
When they start / finish
General information
The reports allow you to estimate the number of listeners starting or finishing listening to selected radio stations in each of the 15-minute intervals of the day.
You can compare data from different intervals and understand how the audience reacts to the broadcast.
Why do you need this report:
To generate the report, you need to select stations and specify the interval.
The report allows you to limit the time of day for which you want to display data by selecting it in the report parameters panel.
The report allows you to limit the time of day for which you want to display data by selecting it in the report parameters panel.
Features:
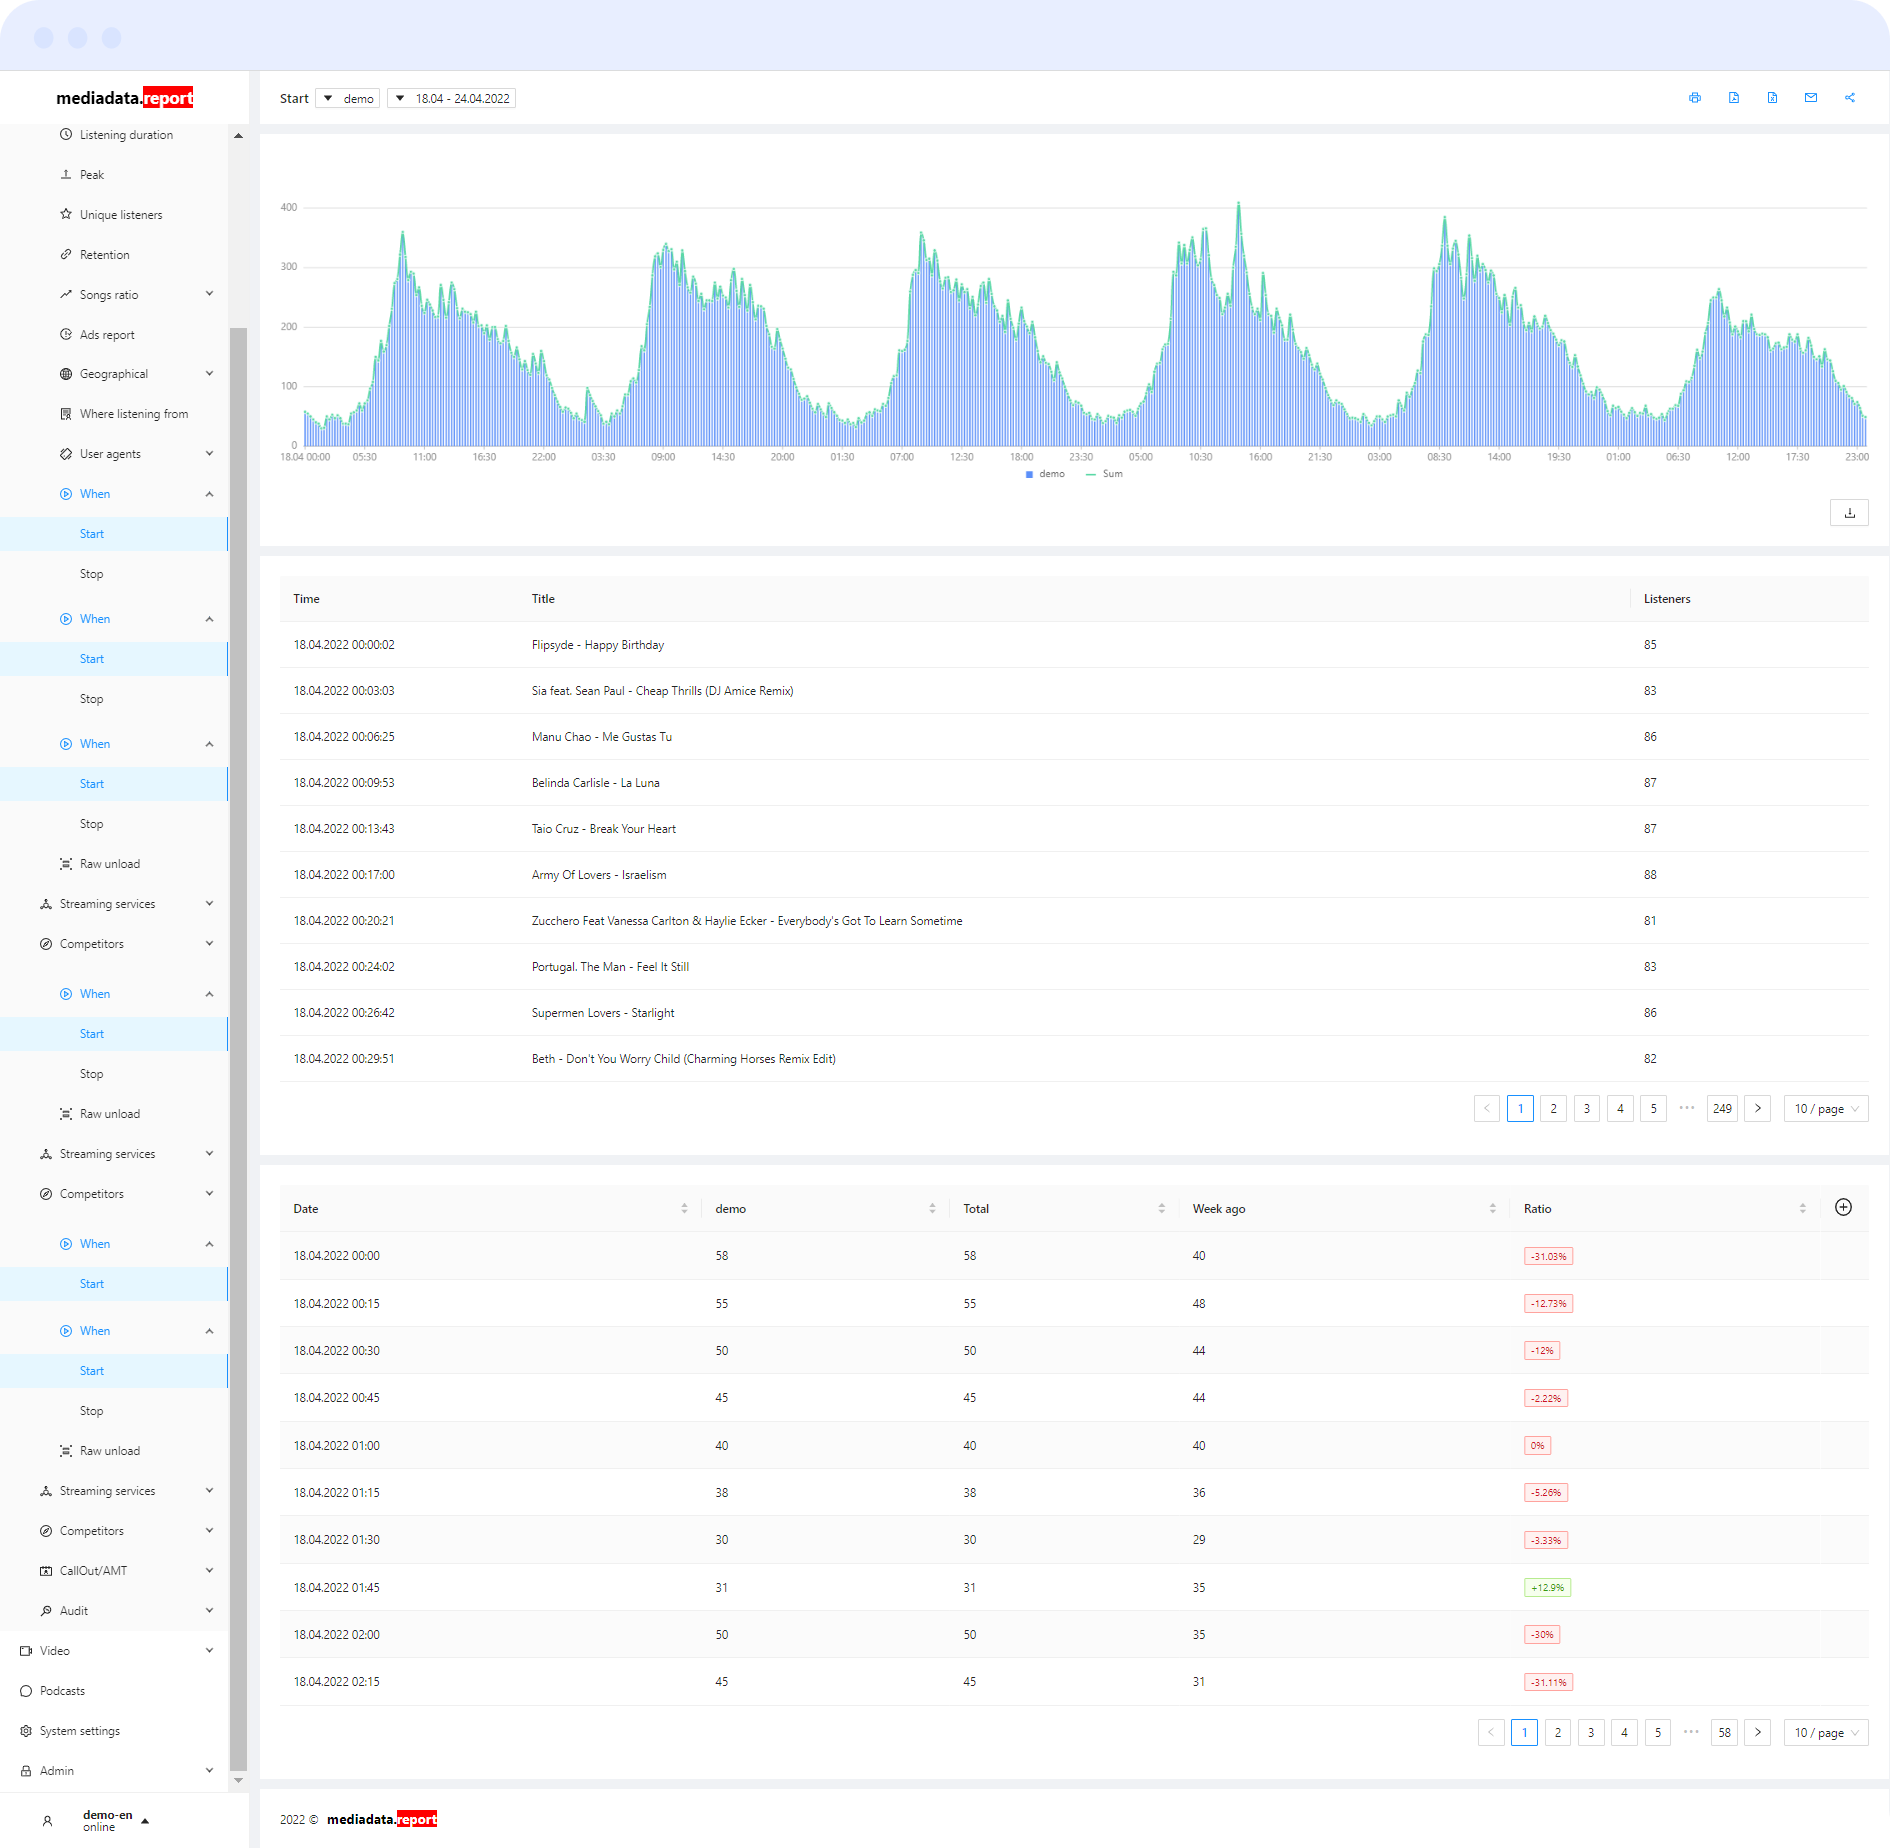
Each report consists of a graph, an ethereal grid and a table with data.
The graph in the form of columns (one for each station in each interval) shows the number of users who start (finish) listening to the station in the specified interval. Above the columns in the form of a line, the total number of users starting (finishing) listening in the interval is displayed for all stations.
The ethereal grid allows you to view the ethereal elements that were played in a particular interval.
The table for each interval contains data on the number of users starting (finishing) listening at each of the radio stations and the total number for all radio stations, the total number for all radio stations a week ago and the percentage of the number of connections (disconnections) a week ago to the current number of the interval.
The report consists of: