
Client applications (OS, browsers, devices)
General information
The reports allow you to estimate the distribution of the audience of radio stations depending on the devices, browsers and operating systems used for listening.
To understand the distribution of listeners by device models, computers, operating systems, browsers
Why do you need this report:
To generate the report, you need to select the period and radio stations.
Features:
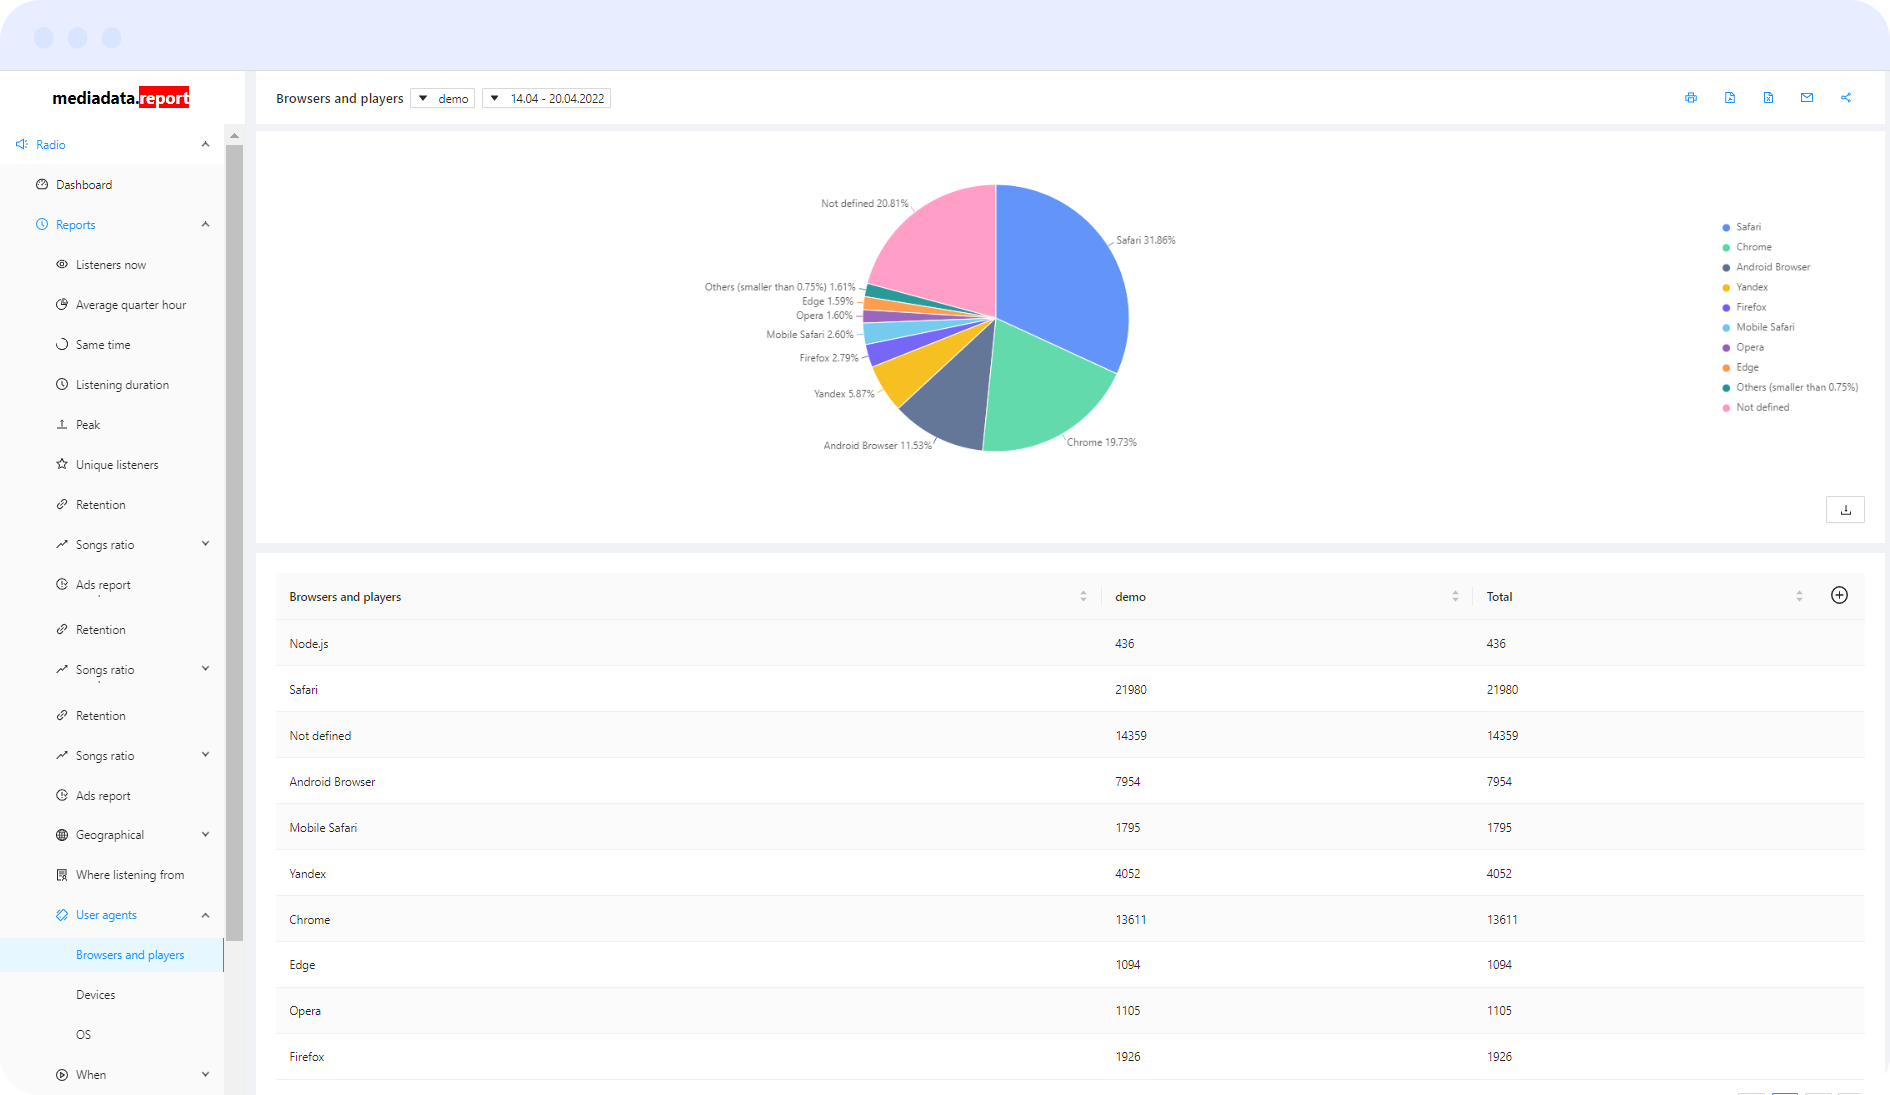
Each report consists of a graph and a table.
The graph in the form of a pie chart shows information about the devices used (browsers, OS). A separate sector indicates the group for which the device (browser, OS) has not been defined.
The table for each device (browser, operating system) indicates the number of listening sessions for each selected station, as well as the total number of listening sessions.
The report consists of: