
Geographical (listeners by country, region, city)
General information
Reports allow you to get data about the geography of users listening to selected radio stations for a selected period.
Understanding the geography of your audience.
Why do you need this report:
To generate the report, you need to select the stations and the period.
The report by region takes into account the base country of the account for which the report is generated: if the base country is specified, then only regions from this country are used in the report.
In reports by regions and cities, positions that occupy less than 0.75% of the total number of auditions are allocated to a separate category "The rest" so as not to clutter the schedule.
The location of the listeners is determined based on the IP address.
Features:
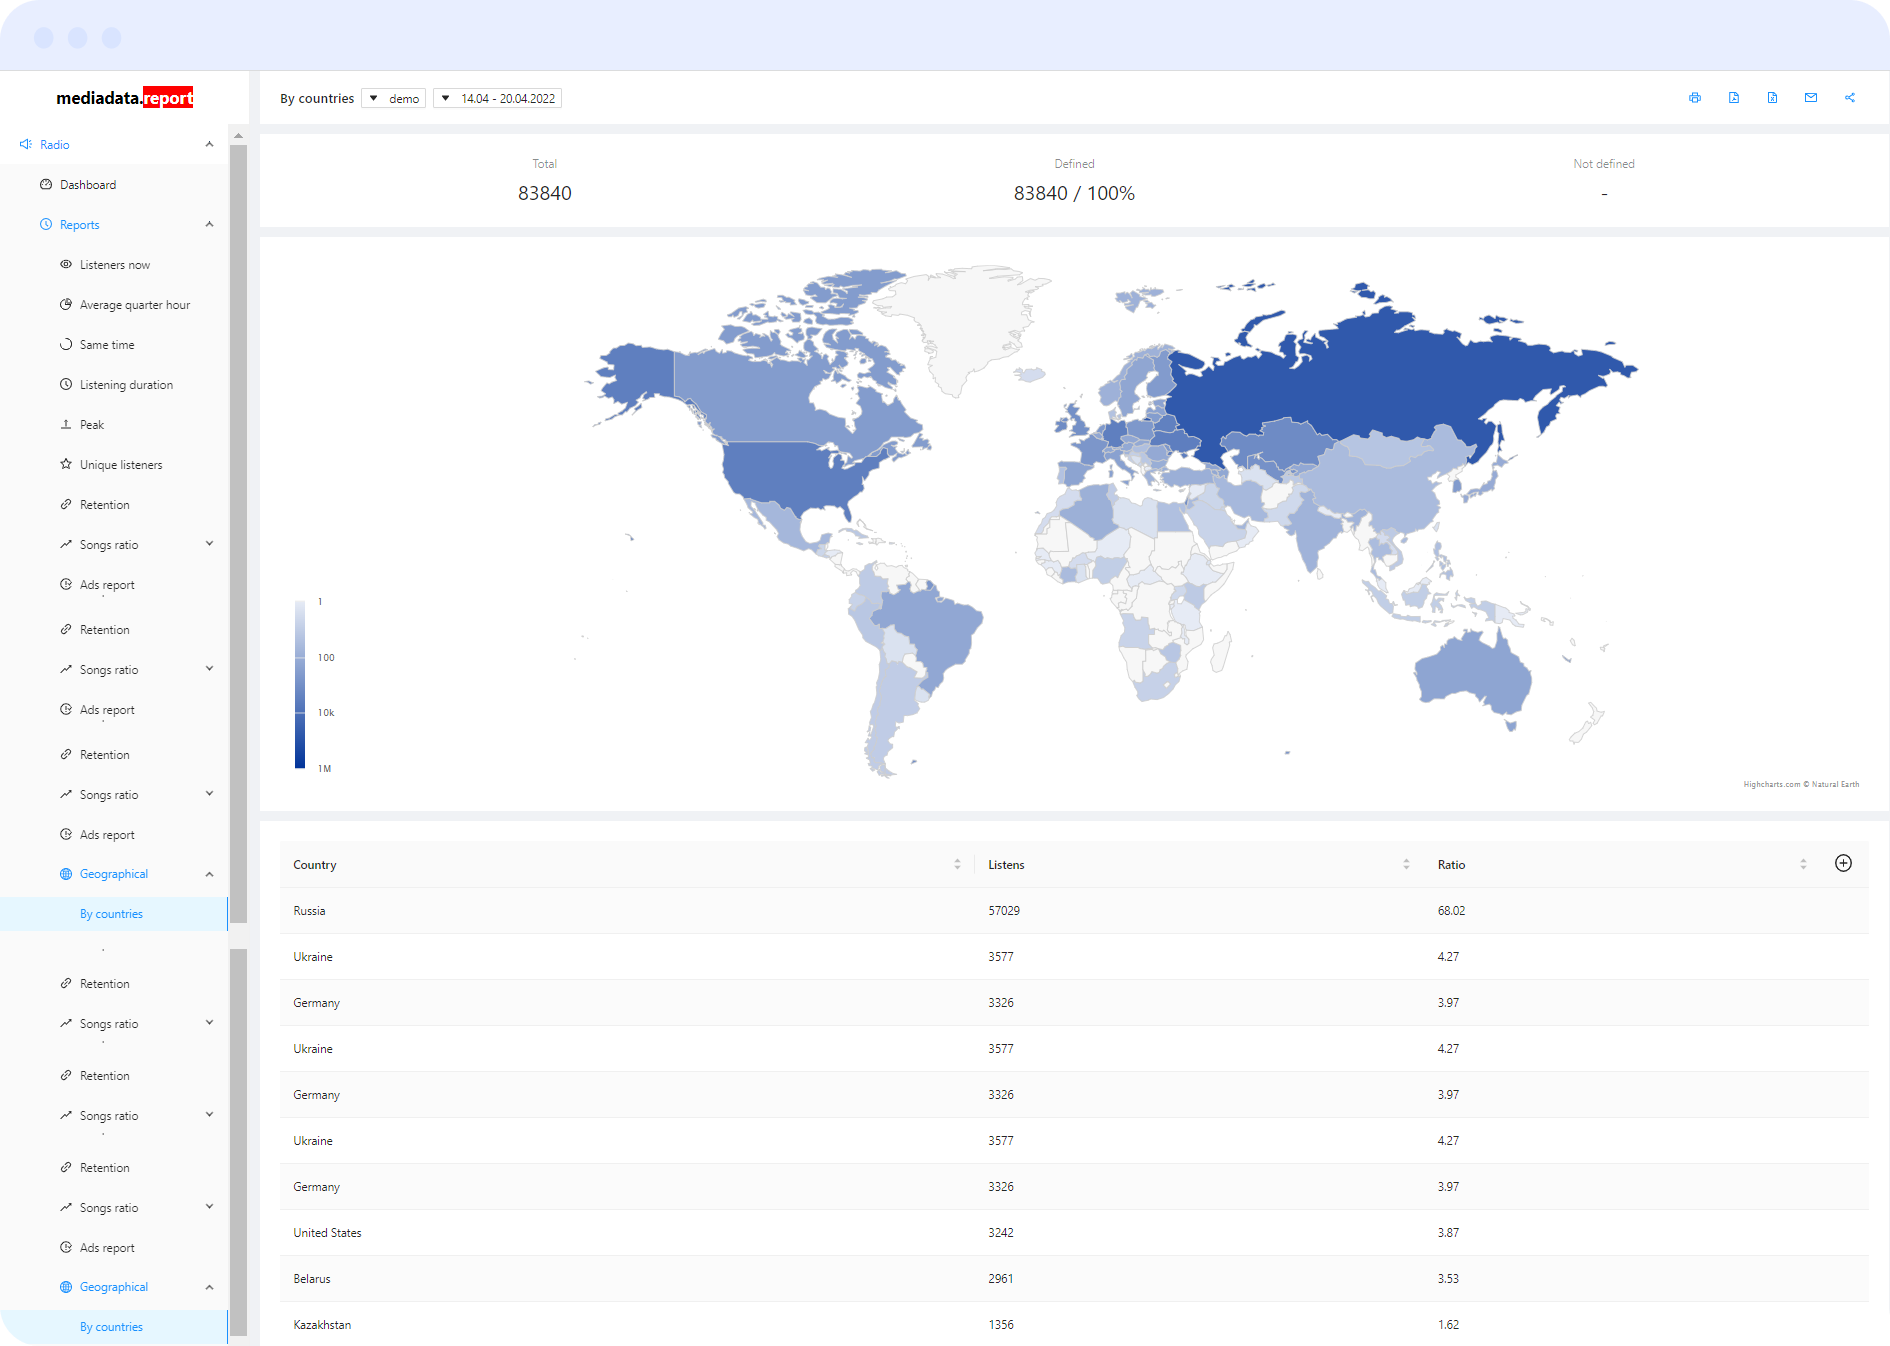
Each report consists of a summary with the main indicators, a visual component (graph or map) and a table with data.
The summary with the main indicators contains information about the total number of auditions for the period, and the number of auditions for which the geographical location of the listener is determined / not determined.
As a visual component for the country report, a world map is used, on which countries with different listening numbers are highlighted in colors of different intensity. For reports by regions and cities, a pie chart is used, on which the regions/ cities of the auditions are plotted as a percentage.
The table for each geographical location shows the name, the number of auditions and the percentage of the total number of auditions.
The report consists of: